Smart Tiff Viewer
Overview
The Smart Tiff Viewer was created to view well log images within a web browser. It is the default way to view well log images from GOMsmart...
Calibration
The bounds of the curves and the depth of the log can be calibrated with a simple interface...
Annotate
Labels and shapes can be added to the image, in various colors and transparency. Once created...
Digitize
Digitizization is done in two ways after clicking the Trace button. The autotrace button...
Add Data
Like the digital log viewer, the Smart TIFF Viewer can integrate other data into the log...
Export
There are three export options for the well log image: The full tiff, the current view in the display...
Overview
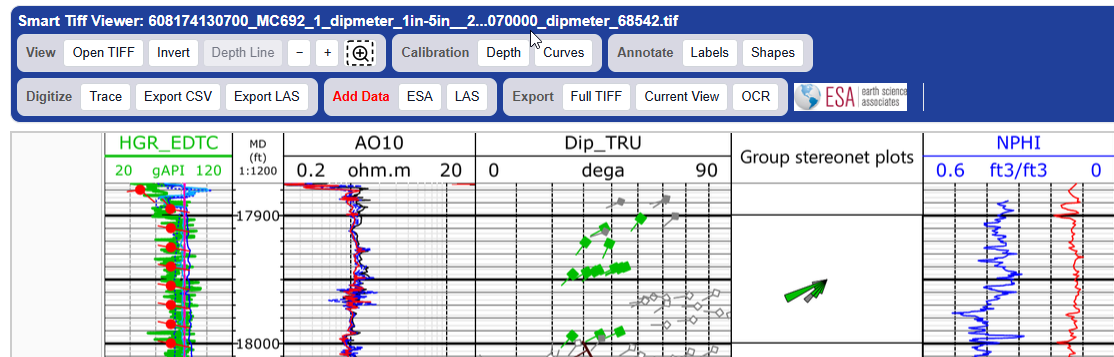
The Smart Tiff Viewer was created to view well log images within a web browser. It is the default way to view well log images from GOMsmart and can be used to open your own well log tiffs from the first button on the left.
Calibration
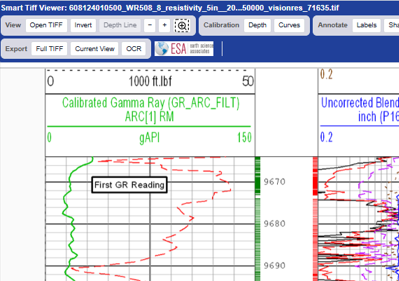
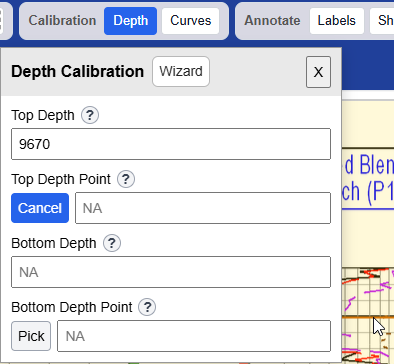
The bounds of the curves and the depth of the log can be calibrated with a simple interface. For the depth, click the Depth button and enter the top depth in the log. Then click the Pick button under Top Depth Point to use the cursor to click the spot on the log image of the matching depth. This is repeated for the bottom depth.
Calibrating the curves is similar. Enter the curve name and units, as well as the leftmost and rightmost values. Then click the arrow pointing left to use the cursor to click the left edge of the proper tract and the arrow pointing right to use the cursor to click on the right edge of the track.
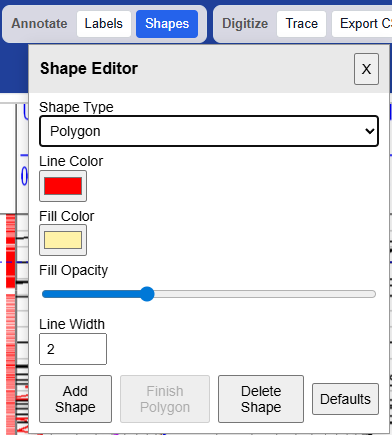
Annotate
Labels and shapes can be added to the image, in various colors and transparency. Once created they can be moved, edited and removed. Shape types include rectangles, circles, polygons, arrows, lines and fixed horizontal lines.
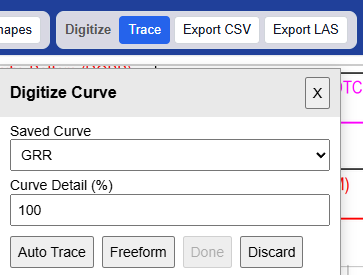
Digitize
Digitizization is done in two ways after clicking the Trace button. The autotrace button attempts to follow a line that is chosen by clicking on the image. The freeform button is used to click on each point of the line manually (or by holding down the mouse button while freely following the line). The Curve Detail specifies the number of points (density) to create - it can be increased to more than 100.
When complete, the new line can be exported to either a CSV or LAS file for further use.
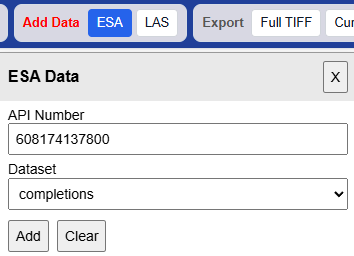
Add Data
Like the digital log viewer, the Smart TIFF Viewer can integrate other data into the log. Once the depth is calibrated for the log, ESA data including completions and paleo observations can be marked at the appropriate depths within the image. These can be edited to change colors and shapes and move labels (the depths are fixed in the correct location). With the second button, LAS files can also be imported to add more curves to the display.
When complete, the new line can be exported to either a CSV or LAS file for further use.
Export
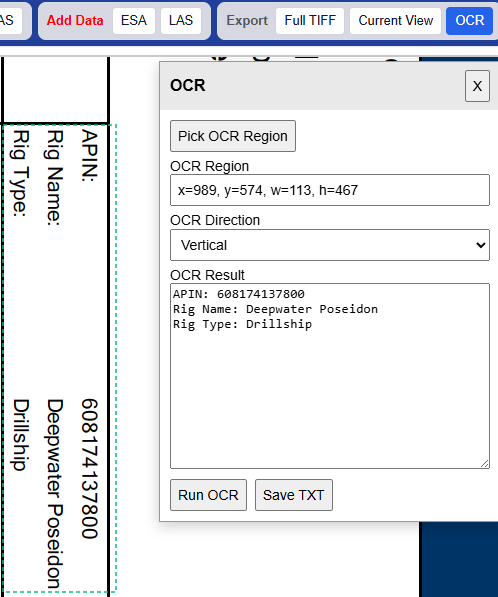
There are three export options for the well log image: The full tiff, the current view in the display and exports of a region using OCR to convert the image to text.
After clicking the Pick OCR Region button, a box is drawn over the area to convert, then a choice of whether the text is arranged horizontally or vertically. Click the Run OCR button to display the text in the window, which can then be saved to a text file with the Save TXT button.