Storm Production Loss Forecast
Overview
This analysis forecasts production lost based on the path, strength and speed of a storm impacting platforms in the Gulf of Mexico. Analysis is based on losses from previous storms, primarily affected by the wind speeds and duration of the winds at each platform.
Input
There are two primary choices on the Storm Production Loss Forecast: A report on production loss by company (or Gulf-wide) and an interactive map to see estimated production loss at each platform. When choosing a company the list includes the top ten platform operators and all others as a single group.
Output
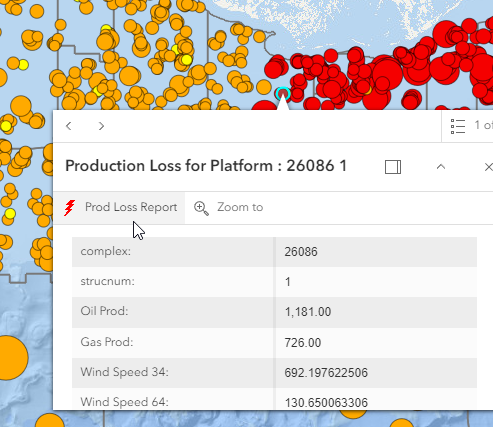
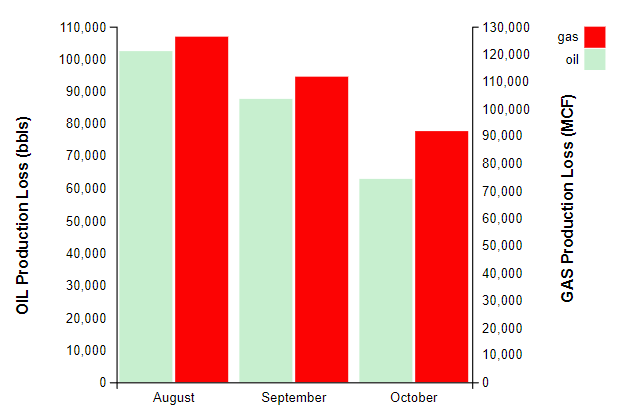
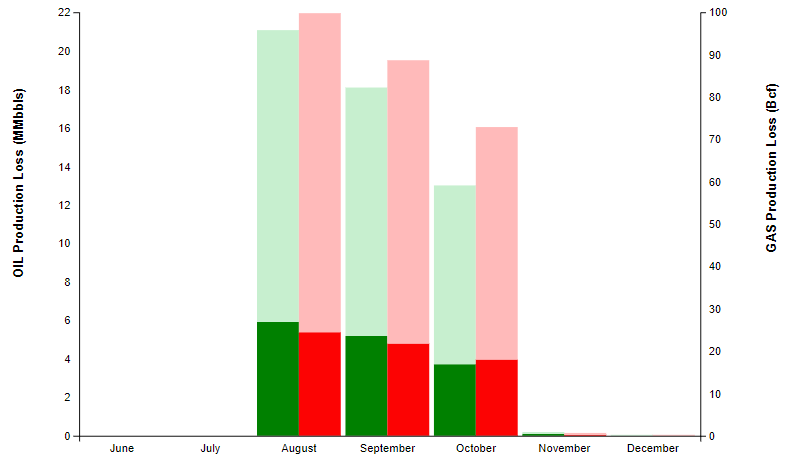
The reports from the main Production Loss Forecast page display the forecasted loss of production from the current month and the following two months. The report includes a graph showing the breakdown of oil and gas losses for each month. The report available from the map, when clicking on a platform, will display both identification information about the platform and the graph of the oil and gas losses for each month.
Interactive Map
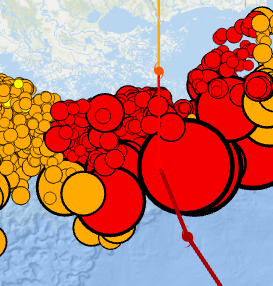
The Platform Production Loss Forecast Map, available by clicking on the Map button on the Storm Production Loss Forecast page, displays platforms sized by total BOE lost (oil and gas) and colored by percentage of total production lost. The map also shows the storm track and wind radii from the National Hurricane Center. Clicking on a platform in the map presents some information, but also the Prod Loss Report button to create a report on the lost production.
Statistical Forecast
Directional windspeed data is available from the National Hurricane Center from storms going back to 2004 as part of their HURDAT2 dataset. This data is interpolated and assigned to active platforms during the storm to create hourly windspeed graphs for every platform. The area under these curves represents total wind force and serves as the basis for regression analysis. Production losses are calculated for the month of the storm and the following two months. Data is aggregated GOM-wide and regression analysis is performed on oil and gas separately on all cyclones with at least storm level winds. A function of the windspeeds of at least 34 knots, at least 64 knots, and previous production produces a good regression model for both oil and gas (R-squared > 0.9).