
Analyze a recorded lease sale
- Open Bidding - sale analysis in the sidebar.
- Select a Lease sale. Check both the recorded sale number and date.
- Click Analyze sale. Exposure, Partners, Bid network and the submitted-sale map share this snapshot.
- Expand Individual sale chart controls above the workspace to adjust the partner selection or network view.
- Click a bar segment, partnership or sale lease to explore linked records; use Clear selection to reset highlights.
Changing the sale clears previous results. Analyze refreshes the selected sale; chart controls, docking and downloads reuse the submitted data.
Focus the sale views
| Control | What it changes |
|---|---|
| Lease sale | Selects one recorded sale/date, independent of the Over Time dashboard’s year range. |
| Companies in chord | Select up to 30 companies for Partners. The initial selection includes up to 12 companies ranked by unique joint-bid value. |
| Company focus | Focuses the network on blocks involving the chosen company, including partners and competing bidders on those blocks. |
| Blocks shown | Choose Top 10 (default), Top 25, Top 50 or All blocks, ranked by total full submitted bid value. |
| Show block labels | Shows or hides network block labels. Network positions are a diagram rather than geographic locations. |
Read exposure, partners and the network
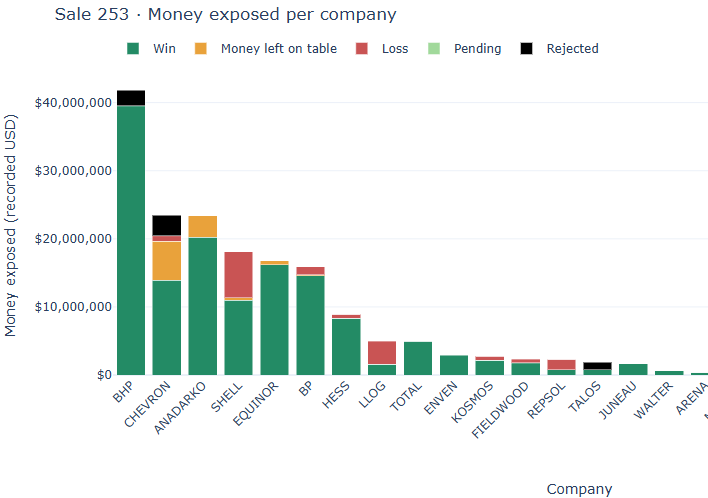
Company exposure
| Stack segment | Meaning |
|---|---|
| Win | The allocated winning high-bid amount remaining after the money-left-on-table component. |
| Money left on table | For Won rank-1 bids, the full high bid minus the recorded rank-2 bid, allocated by recorded company share. If there is no second bid, this component is zero. |
| Loss | The company’s allocated lower-ranked losing bids. |
| Rejected | Allocated high bids classified as rejected under the dashboard’s assessment and lease-status rules. Shown in black. |
| Pending | Allocated high bids that remain pending under those rules. Shown in light green. |
The segments divide submitted exposure without counting the high bid twice. Company dollars use recorded bid percentages without normalizing them. A recorded but invalid second bid leaves the Win/Money left on table split unknown.
Partners
Each ribbon connects companies in the same joint bid. Competitors on the same block are not partners. Ribbon width sums full recorded joint-bid values for that pair. A bid with three partners contributes to three pairs, so ribbon values overlap and must not be summed as total company or sale exposure. Hover for exact values.
Bid network
Squares represent companies, diamonds full bids and circles blocks. Company-to-bid links show company-share dollars; bid-to-block links show the full bid once. These levels describe the same money and are not additive. Dotted connections indicate unknown allocations.
Link charts to the sale map
Drag a panel header onto another panel to swap their positions. For keyboard operation, focus the header and use the arrow keys. Layouts stay with the current browser session, and panels stack on smaller screens. Hover over chart observations for details; use chart zoom and legend controls where available.
Tables and CSV downloads appear below the chart workspace. Expand the relevant table to see its contents. The dashboard’s method and data-quality guide is at the bottom.
Click an Exposure segment to select leases contributing positive known dollars to that exact company/outcome. Matching sale leases, displayed network paths and joint-bid relationships highlight in cyan. A map lease click selects that lease; a network block click selects its submitted leases. A partner ribbon selects its pair’s leases, while an arc selects leases behind that company’s displayed partnerships.
The Lease information window shows recorded full high and second bids and their respective bidders. It supports multiple lease cards and configured Lease info / View in map links. Close keeps highlights; Clear selection resets them.
The map uses Leases from submitted sale, rather than treating current leases as historical sale footprints. Zoom to 1:300,000 or closer for available high/second-bid labels. A bid without a matching lease polygon still appears in tables and charts.
Download sale and relationship details
Expand Company exposure and bid counts, High-bid rejection assessments and Company bid breakdown to inspect totals, classification inputs and individual allocations.
Partners has relationship, company-summary and joint-bid-detail CSVs, plus a selected-pairs download. Network tables describe displayed companies, blocks, bids and connections; separate full-sale bids and company-allocation CSVs preserve the complete submitted sale.
Each analysis has a collapsed guide below the tables. Use it to review allocation quality, missing values and the outcome rules.
Understand bidding outcomes
A recorded rank-1 bid is a high bid, not proof of government acceptance. The dashboard combines available assessment thresholds with recorded lease status. A high bid must strictly exceed the minimum usable assessment; equality fails. Certain rejection/cancellation statuses also force rejection. Otherwise Pending remains separate, and other or missing/unmatched statuses are treated as Won under the application’s acceptance assumption.
- Current lease status does not reconstruct the decision as it stood at the historical sale date.
- These are submitted nominal USD amounts, not payments. GDP normalization is available only on Bidding – Over Time.
- Unknown or zero allocations do not create positive-exposure lease highlights. Missing amounts and company shares remain explicit in the detail tables.
- Partner and network filters change the displayed view without expanding its selection to unrelated leases.