
Find decommissioning assets
- Open Decommissioning in the application sidebar.
- Choose Search by → Existing field and select a field to search its linked assets directly. Its recorded measurements are displayed, with numeric controls inactive.
- Alternatively, choose Describe field and enter water depth, completion depth, completion interval thickness, minimum history, number of analogs and cutoff year.
- Click Find decommissioning assets to load the current selection.
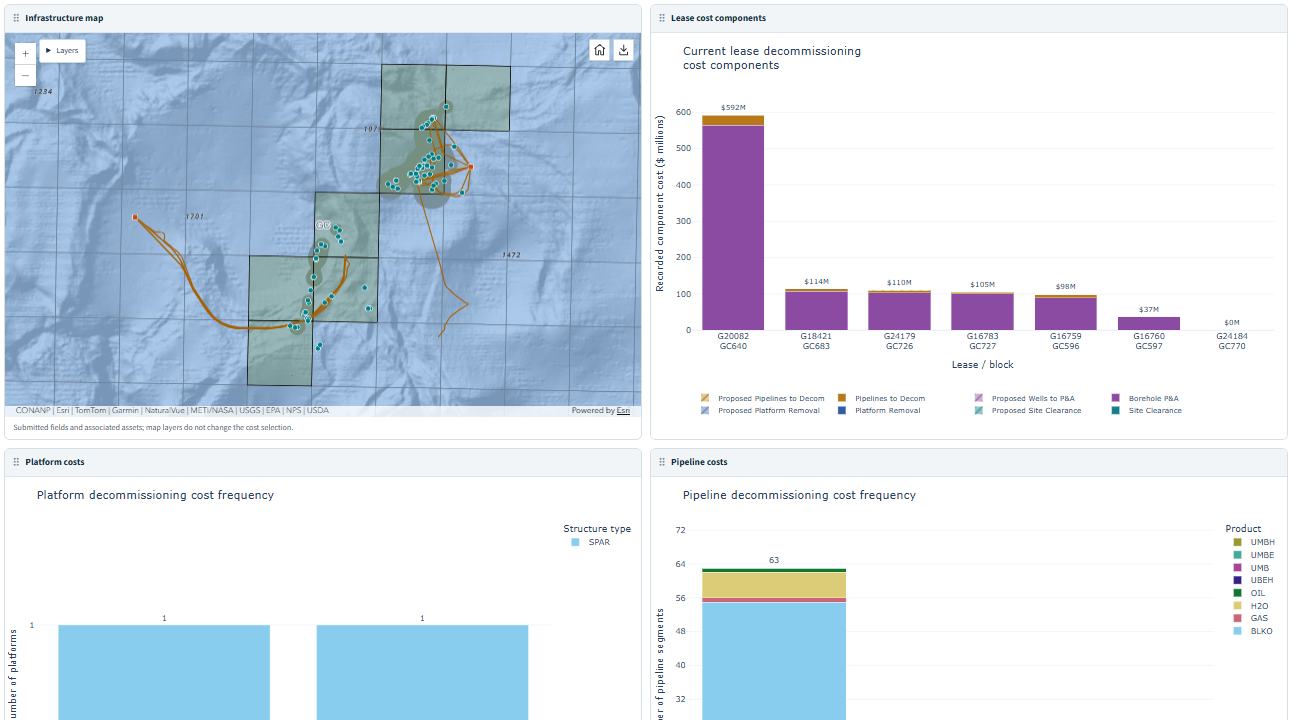
- Review Lease cost components, Well costs, Platform costs and Pipeline costs alongside the Infrastructure map.
Choose the search and display
| Control | What changes |
|---|---|
| Existing field | Searches one selected field’s associated assets directly. Completion metrics and minimum history are not required to perform this search. |
| Describe field | Ranks analog fields using the same three-measurement similarity method and minimum-history rule as Analog field development, then pools their unique associated assets. |
| Include activity through year | In Describe field mode, changes analog eligibility. It does not impose a date cutoff on asset costs. |
| Group by structure type | Splits platform costs by recorded structure type. |
| Group pipelines by product | Splits pipeline costs by recorded product. |
| Group wells by status | Splits well costs by recorded well status. |
Search changes clear previous results; click Find decommissioning assets again. Grouping and workspace changes reuse the submitted results.
Read the cost panels
Lease cost components
Each stacked bar represents a current lease on the selected fields’ recorded blocks. Eight components distinguish recorded and proposed well, pipeline, platform and site-clearance liabilities. Bar labels sum available components.
Asset costs
Existing field uses frequency bars: bar heights count unique assets at a recorded cost or within a cost range. Hover for counts and summed estimates. Describe field uses asset dots and, where there are enough distinct values, boxes showing the middle 50%, median and mean. Horizontal separation of dots does not indicate geography or time.
Asset charts show millions of dollars; tables retain dollar amounts. Platform, pipeline and well estimates are separate distributions of pooled unique assets, rather than averages of field costs.
Lease component estimates and individual asset estimates are independent views. Do not add them together to calculate a combined field liability.
Explore assets and the map
Drag a panel header onto another panel to swap their positions. For keyboard operation, focus the header and use the arrow keys. Layouts stay with the current browser session, and panels stack on smaller screens. Hover over chart observations for details; use chart zoom and legend controls where available.
Tables and CSV downloads appear below the chart workspace. Expand the relevant table to see its contents. The dashboard’s method and data-quality guide is at the bottom.
Click an asset cost dot, a frequency bar, or an eligible asset on the map to highlight matching assets in cyan. A frequency bar selects its member assets. The movable Asset information window shows submitted details and configured asset/map links. Close keeps the highlight; Clear selection removes it.
Map layers provide context and do not change the cost selection. Field blocks identify originating pipeline segments; their destination blocks identify eligible platforms. These block associations do not establish exact physical connections. A nearest-platform fallback may be used for a field with no eligible originating pipelines and usable field coordinates; the guide identifies that geographic substitute.
Review and download details
Use Cost totals and expand Selected platforms and cost estimates, Selected pipelines and cost estimates, Selected wells and cost estimates, or Current leases and decommissioning components. Review CSVs for recorded estimates, the chosen estimate source, assessment metadata and field associations.
Additional tables describe selected analog fields, field search results, asset associations and pipeline block associations. The bottom Decommissioning guide, method and data quality explains unavailable estimates, selection rules and any fallback.
Understand estimate coverage
- Asset estimates generally prefer a finite, nonnegative P70 estimate, with a deterministic fallback. If P70 is zero and deterministic is positive, deterministic is used. Zero paired with zero or a missing counterpart is unavailable.
- Missing or invalid estimates stay unknown. An unavailable chart value is not a zero-cost obligation.
- Associated infrastructure can serve more than one field. Unique assets are counted once in the pooled selection, with no allocation of shared costs to individual fields.
- Well estimates use full recorded API numbers directly linked to fields. Drilling-project grouping and the development cutoff do not limit these well costs.
- Dollar amounts are recorded estimates with no inflation adjustment. Asset and lease assessment sources can have different coverage and dates.
- If no assets or usable estimates appear, check the selected field, association/fallback notes and quality counts before trying another search.