The ability to quickly estimate the amount of production lost or delayed due to an active storm is vital when evaluating economic impacts. Using regression analysis from past storms, the Storm Production Loss Forecast analysis does exactly that with a storm active in the Gulf.
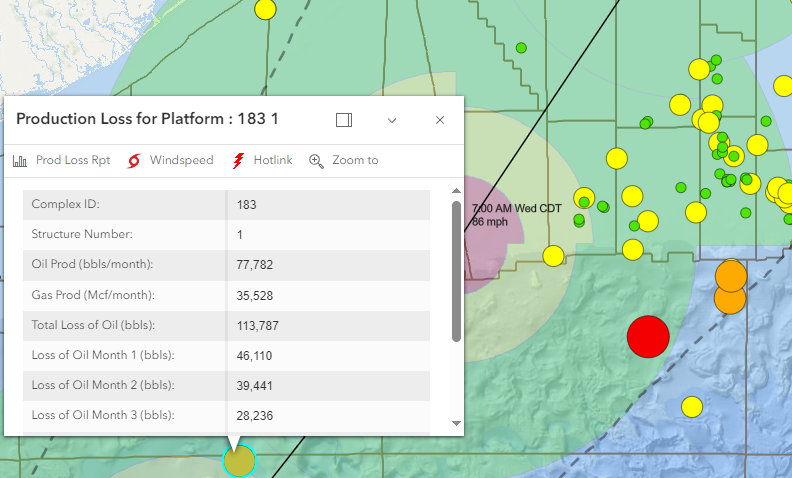
The interface is straightforward: A report on production loss by company (or Gulf-wide) and an interactive map to see estimated production loss at each platform. When choosing a company the list includes the top platform operators and all others as a single group. Within the map, each platform can be clicked to view the forecast. Platforms are sized by the forecasted loss and colored by the percentage of monthly production lost (from red for a high percentage to blue for a low percentage).

The minimal oil production loss forecasted for the Hoover SPAR due to winds from Francine in 2024.
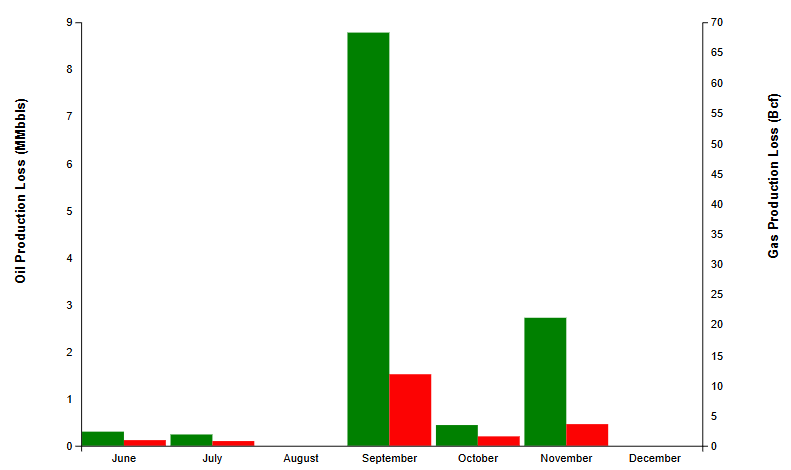
The reports from the Production Loss Forecast page display the forecasted loss of production for the current month and the following two months, broken down by previous and current storms. The report includes a graph as shown below. The report available from the map, when clicking on a platform, will display both identification information about the platform and the graph of the oil and gas losses for each month.

The production loss forecast for each month of the 2024 hurricane season.
Multiple Windspeed Radii from the National Hurricane Center are interpolated and assigned to active platforms during the storm to create hourly windspeed graphs for every platform. The total wind force, considering speed and duration, serves as the basis for regression analysis. Production losses are calculated for the month of the storm and, in the case of hurricanes, the following two months. Data is aggregated GOM-wide and regression analysis is performed on oil and gas separately on all cyclones with at least storm level winds. A function of the windspeeds of at least 34 knots, at least 64 knots, and previous production produces a good regression model for both oil and gas (R-squared > 0.9).


