Shazam!


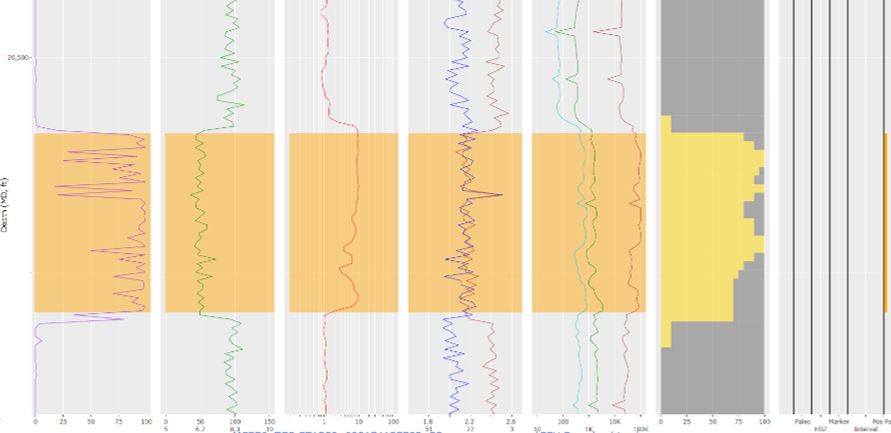
Shazam applies several deep learning models, multilayer perceptron, transformer prediction and transformer ensemble models, to identify unproduced accumulations in wells. A total of 10 curves are analyzed, depending on what is available in each well. The curves used are TVD, gamma ray and resistivity, bulk density, neutron density, C1, C2 and C3 gases and lithology (see Figure 1, tracks 2-6).

The result, for each -ft interval in the well, is a probability of pay score, ranging from 0% to 100% (Figure 1, track 1). If the score exceeds a model-specific threshold level (e.g., 75% in Figure 1), a candidate potential pay is identified (gold). For wells with fewer log curves available, higher thresholds are imposed, recognizing the greater uncertainty in results based on less information.

As each unproduced candidate is identified, a risked estimated ultimate recovery is calculated based on local analogs. For at least 15 neighboring completions within the same stratigraphic interval, oil and gas EURs per foot of completion are calculated based on cumulative production and estimated reserves in GOM3/GOMsmart. Their weighted average is calculated, with completions closest to the candidate unproduced accumulation given the highest weight and exponentially less weight assigned as a function of distance away.

Log Example Figure 1. A well in Mississippi Canyon analyzed with Shazam. A potentially productive unproduced accumulation is identified in gold, associated with a Shazam probability of pay greater than 75% (dashed line in track 1).
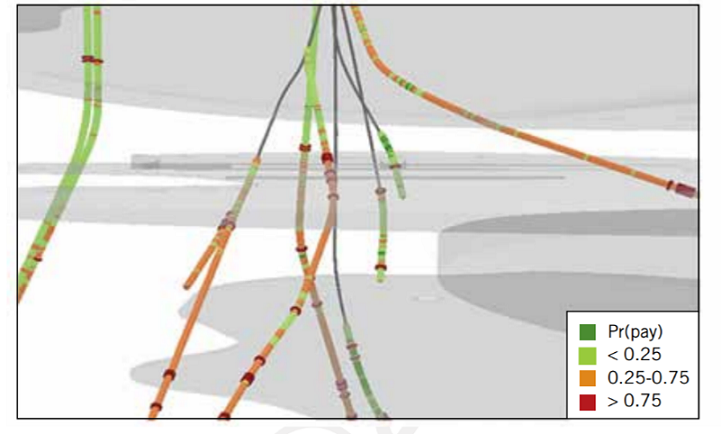
Because Shazam is available within GOM3, its ability to map in 3D can be exploited (Figure 2). Shazam-generated probabilities of pay are used to legend boreholes and place them in context with existing productive sands as well as other vector data, like paleo and productive completions. In the 3D component of GOM3, wellbores can be changed back and forth to show Shazam results or the individual log curves that we input to that analysis.

3D Example Figure 2. From GOM3, a 3D map of the Mars-Ursa field in which boreholes are legended by the Shazam-estimated probability of pay. Existing reservoirs are in translucent gray. This type of mapping highlights where identified unproduced accumulations are with respect to existing productive accumulations.
Because of the comprehensive data in GOM3/GOMsmart on leasing, the owners and operators of leases containing candidate unproduced accumulations can be obtained with a click. Likewise for the lease expiration date and data on production, facilities and abandonment liabilities. These results can be combined with our Tie-Back Tool, to examine transportation options open to Shazam-identified targets.

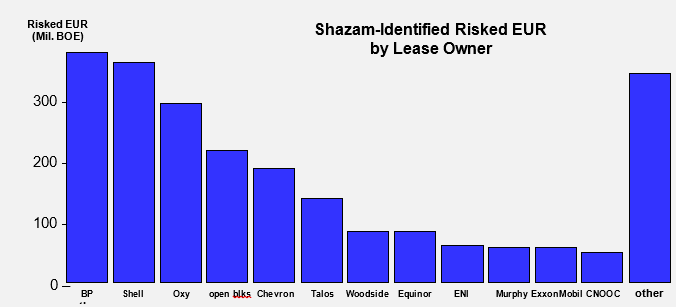
Integrating Shazam results and leasing data, Figure 3 summarizes the total risked BOE volumes found by Shazam across the Gulf, divided by the lease owners for the blocks on which they were found. The fourth largest volume was found in abandoned wells on relinquished/open blocks, providing new field exploration insights.

3D Example Figure 3. Gulf-wide risked BOE EUR in unproduced accumulations identified by Shazam, divided by lease owners, as of Jan. 2025.
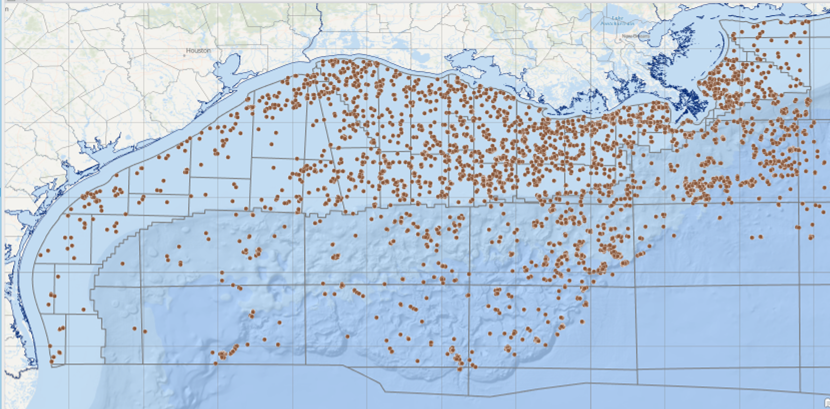
The Shazam analysis is updated whenever BOEM/BSSE releases new digital well logs. We automatically make them available in the Well Log Viewer and apply the Shazam models to them. Those results are immediately added to the 5,550 wells already covered, giving users fully up-to-date analysis (Figure 4).

The Shazam methodology is applied here to Gulf wells. However, the same approach can be applied to basins around the world having digital well logs, completion data and stratigraphic information. Contact us for more information about integrating Shazam into your workflows at contactesa@earthsci.com.

3D Example Figure 4. Shazam coverage as of Jan. 1, 2025.

For information about subscribing to Shazam, or to schedule a demo, please contact us at contactesa@earthsci.com or call: 562-428-3181.